
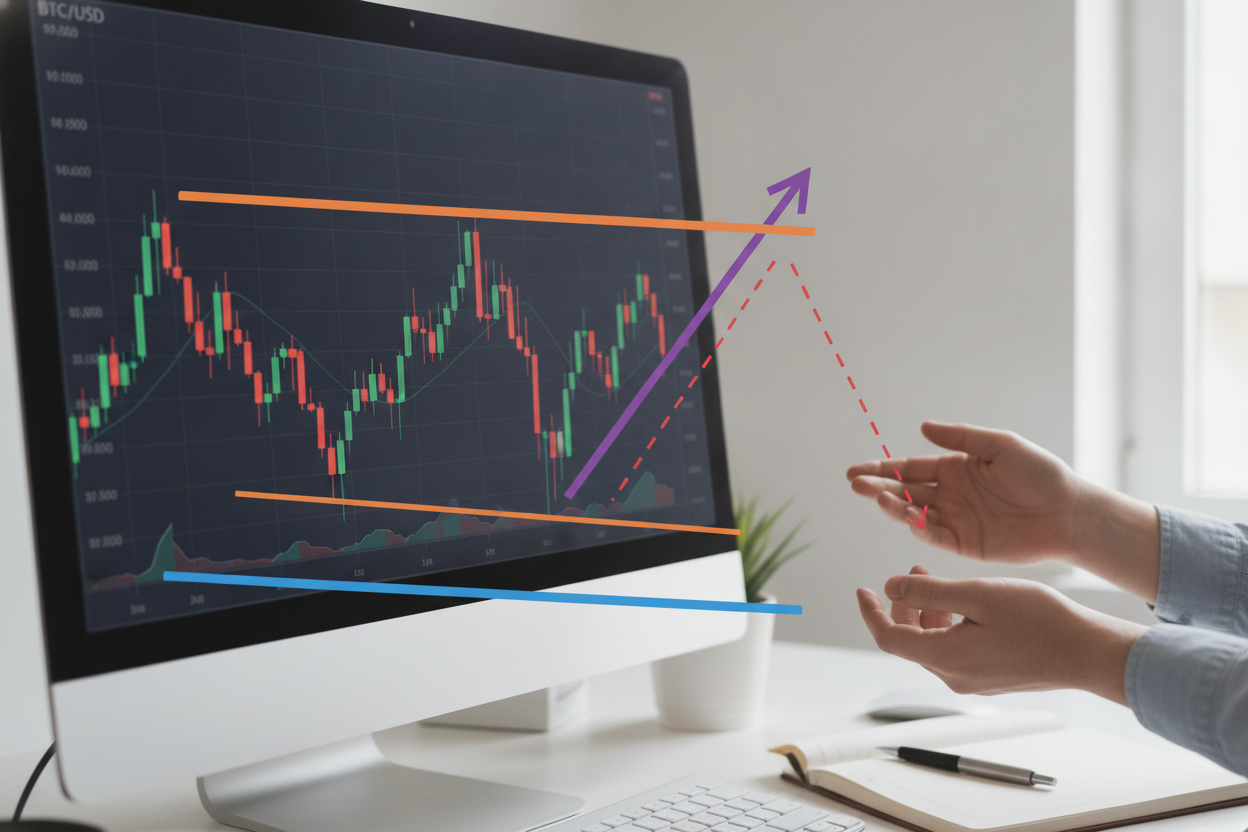
Reading crypto charts does not need to feel intimidating. At the core, charts simply help you see how price has moved over time and whether momentum is building or fading. Once you understand the basics, you can use charts to make better decisions rather than reacting emotionally to every candle on the screen.
Start by looking at trend direction. Is the asset making higher highs, lower lows, or moving sideways in a range? That simple question can reveal a lot about market structure. From there, focus on support and resistance, which are price zones where buyers or sellers tend to step in. These areas are not perfect lines, but they are useful reference points for planning entries, exits, and risk.
Volume is another important clue. A breakout with strong volume often carries more weight than one that happens quietly. Likewise, a pullback on lighter volume may suggest temporary cooling rather than a major reversal. Traders also use moving averages, relative strength, and timeframe comparison to build a more complete picture of the market.
For beginners, the most important habit is consistency. Review the same few indicators, use the same timeframes, and avoid overcomplicating the process. With practice, chart reading becomes less about guessing and more about understanding probability. That mindset can help the KokomoCrypto audience respond to market changes with more confidence and less stress.
Leave a Reply